
Profile
how-to Steps to accomplish one task
On this page
- View the data profile
- Act on profile insights
- Refresh the profile
- Verify the result
- If something goes wrong
After a data set finishes uploading, CluedIn computes a data profile for it: the row count, and for each column, its detected data type, how many values are missing, how many distinct values it has, a few example values, its most common value format, and other columns whose values move together with it. You can view this profile on the Profile tab of the data set.
The profile is also structured so that it can be used later to help identify relationships between data sets.
View the data profile
-
Go to the data set, and then select the Profile tab.
-
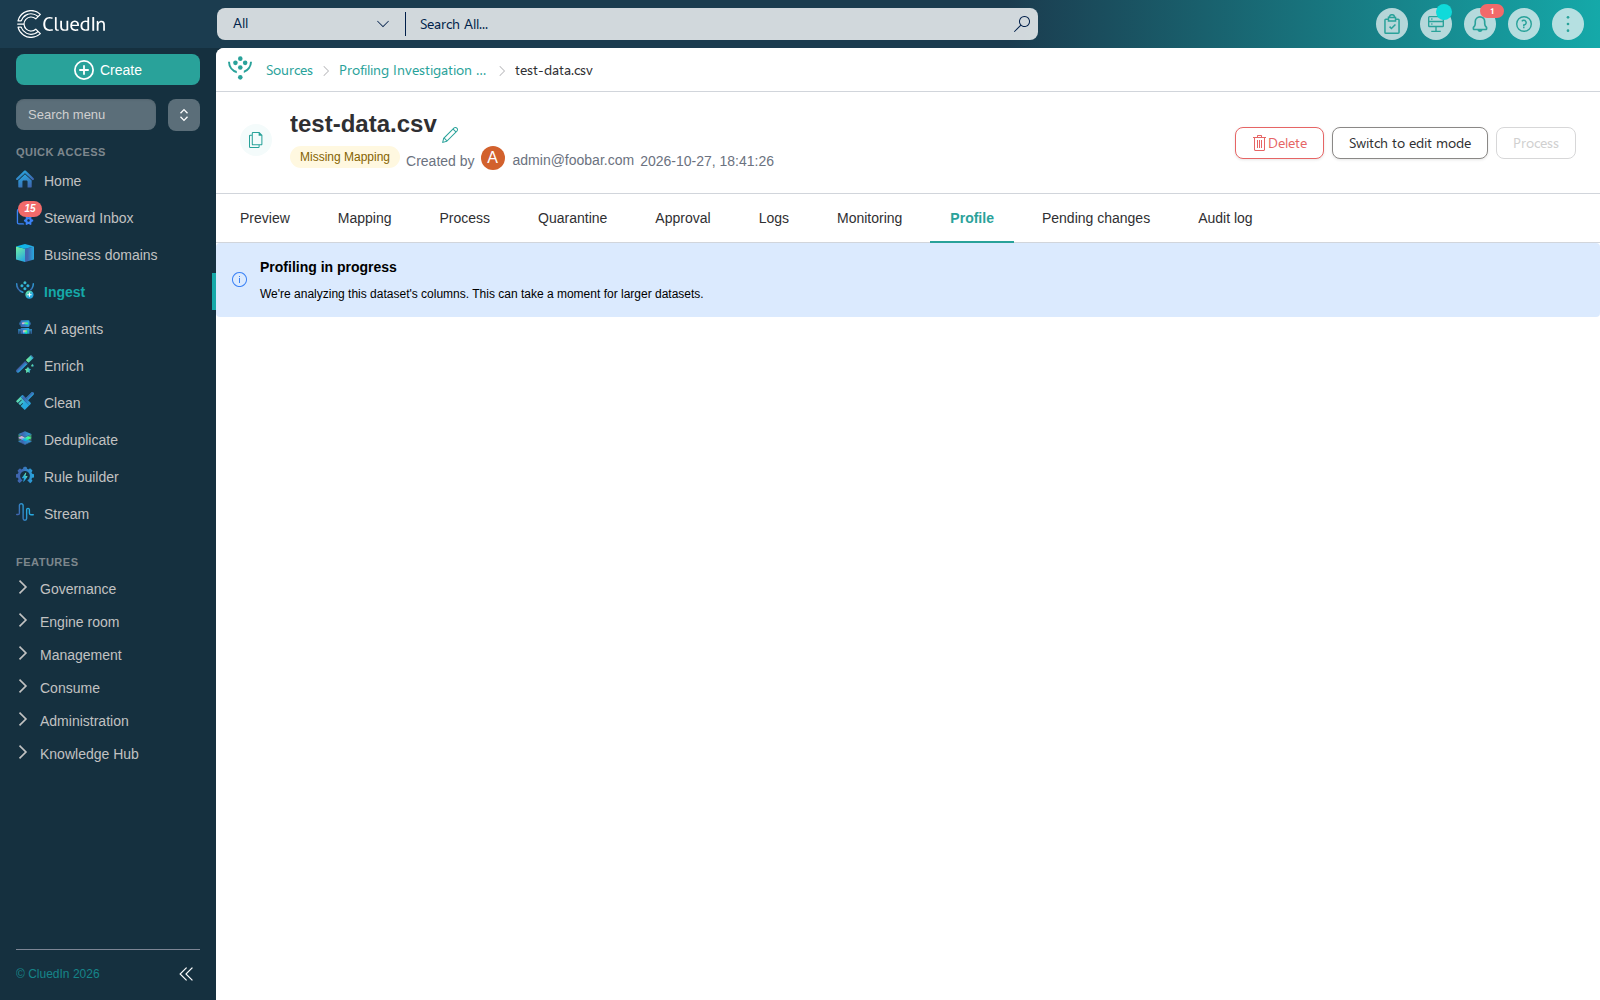
If the profile is still being computed, the tab shows a Profiling in progress message. Wait a moment and check back - profiling usually finishes quickly, but can take longer for larger data sets.
-
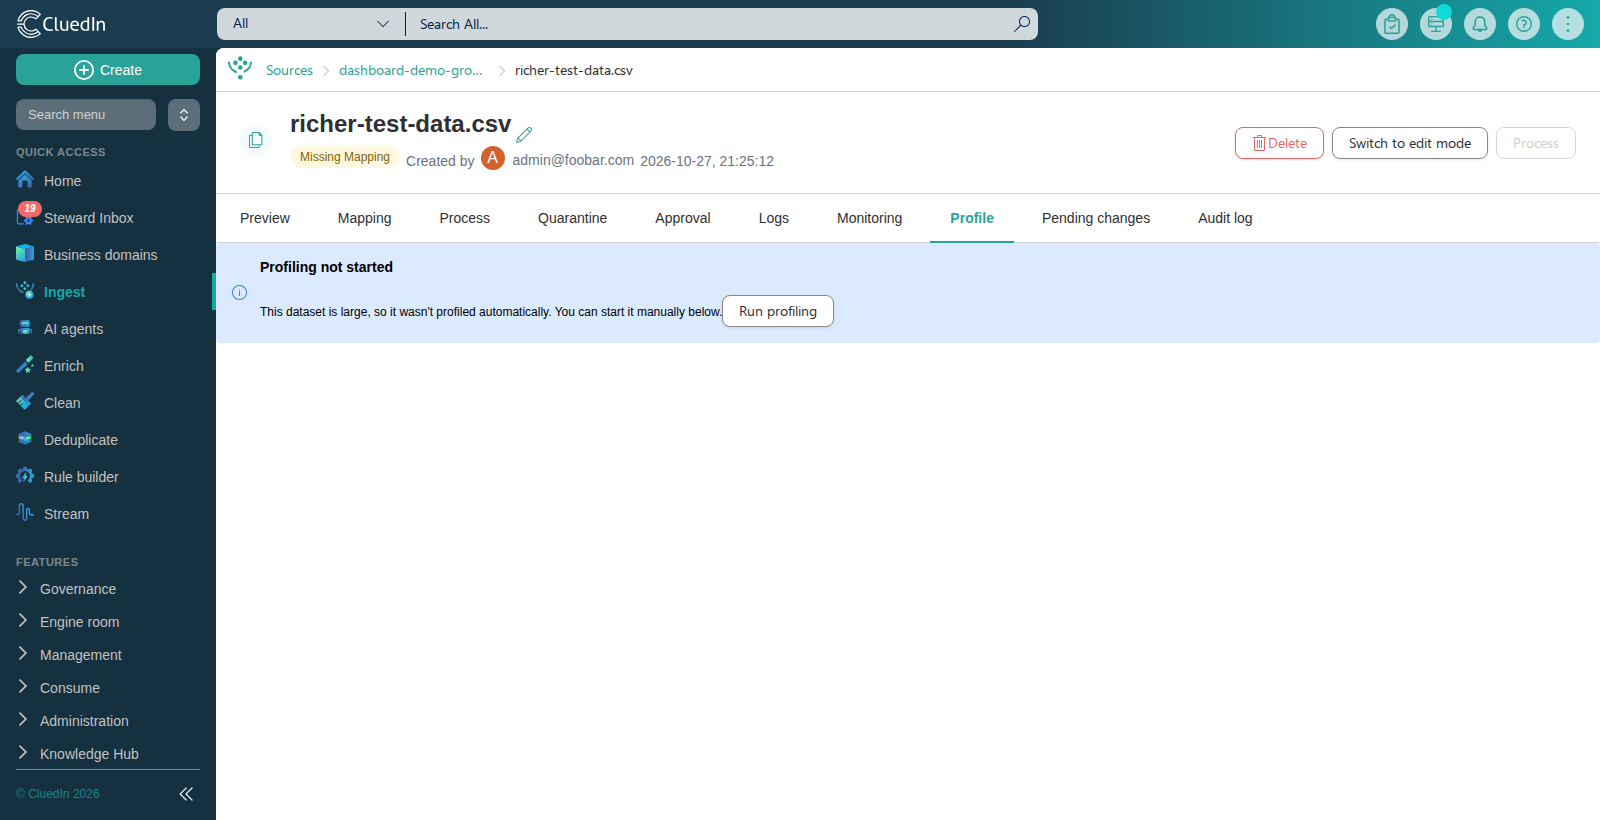
For a data set larger than a configurable row count (1,000,000 rows by default), the tab instead shows a Profiling not started message with a Run profiling button - profiling such a large data set is not started automatically, to avoid the cost of doing so for every upload. Select Run profiling to compute it anyway. An organization admin can change the threshold, or turn automatic profiling back on for large data sets, from Settings > Advanced settings > Data set profiling.
-
Once profiling finishes, the tab shows summary tiles and a table with one row per column.
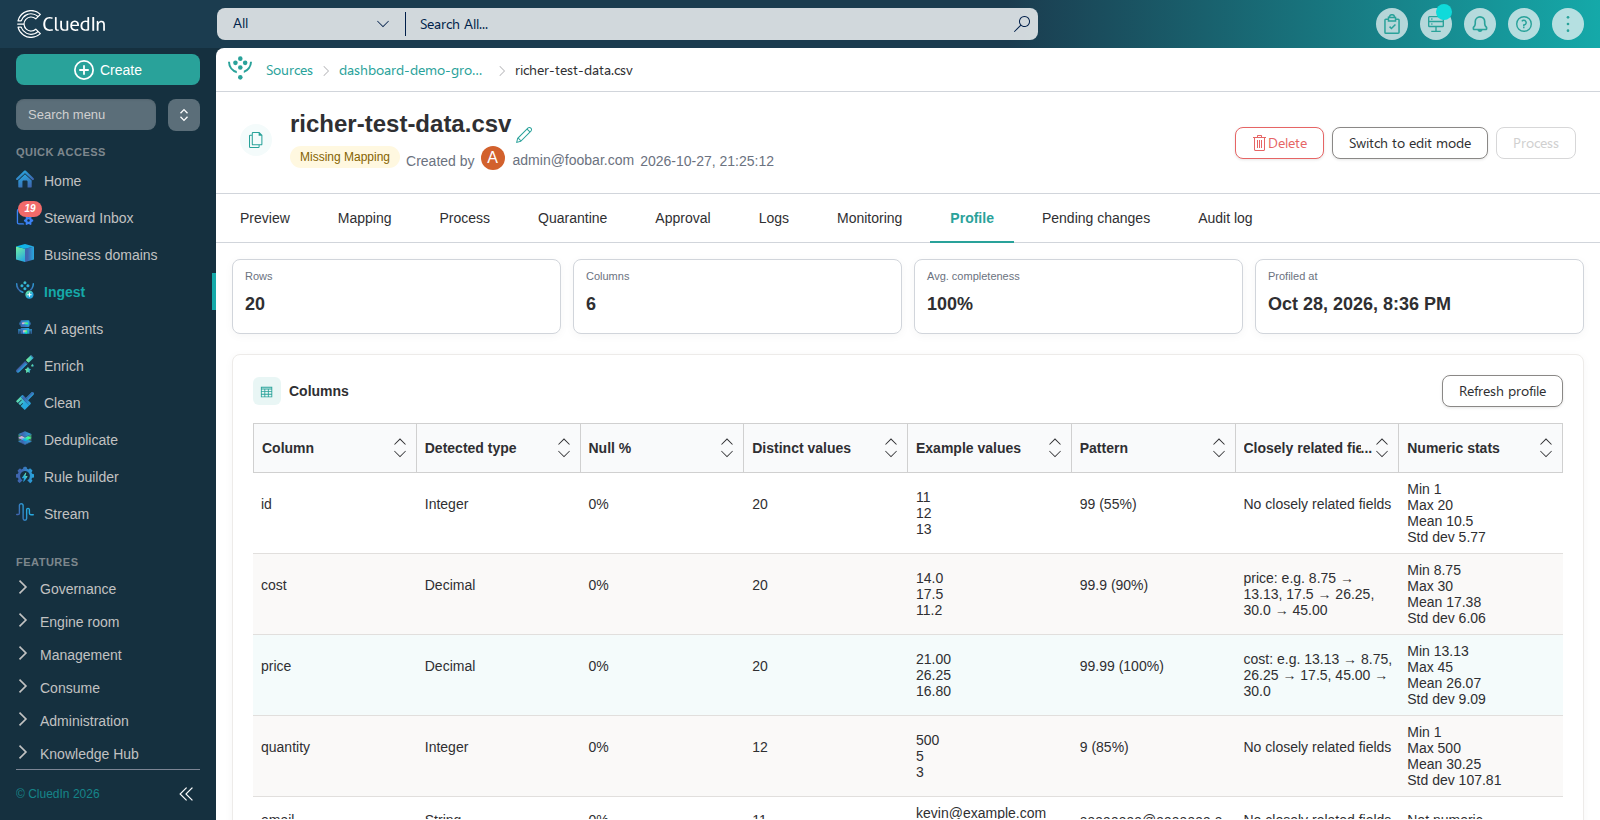
The summary tiles show the total row count, column count, average completeness across all columns, and when the profile was computed. The table includes the following information for each column:
-
Detected type – the data type CluedIn inferred from the column’s values, such as Integer, Decimal, Boolean, DateTime, or String.
-
Null % – the percentage of records where the column is empty or missing a value.
-
Distinct values – the number of unique values found in the column.
-
Example values – a few of the distinct values found in the column.
-
Pattern – the column’s most common value “shape”, with digits collapsed to
9, uppercase letters toA, and lowercase letters toa, and the share of the column’s values that share it. Only shown when it covers more than a tenth of the column’s values; this can reveal structure a column’s detected type alone does not, such as a text column that is consistently formatted as an email address or a fixed-width code. A column with nothing to report shows No repeating pattern. -
Closely related fields – other columns whose values move together with this one, each with a couple of real value pairs so you can see the relationship rather than infer it from a statistic. Only a strong relationship is shown; two columns that merely happen to drift together are left out. A column with nothing to report shows No closely related fields.
-
Numeric stats – for an Integer or Decimal column, its minimum, maximum, mean, and standard deviation across the column’s filled values. A non-numeric column shows Not numeric.
Profiling reads at most the first 10,000 rows of a larger data set. When it does, a note under Columns says how many of the data set’s rows the statistics are based on.
-
Act on profile insights
Above the columns table, the Insights card lists what the profile found that is worth acting on, problems first, each with a button that applies the fix or opens the page where you make it:
| Insight | When it shows | Button |
|---|---|---|
| A column has no values | Every profiled record leaves the column empty. | Review mapping – opens the mapping’s Columns page, where you can stop mapping the column. |
| A column is missing in N% of records | At least half of the profiled records leave the column empty. | Review mapping |
| A column has values with leading or trailing spaces | Some of the column’s example values start or end with a space. | Clean in Preview – opens the Preview tab, where you can apply a trim operation to the column. |
| A column is complete and unique | The column has a value in every profiled record, and no two records share it. Not shown for a column that is already the primary identifier. | Use as primary identifier – makes the column’s vocabulary key the mapping’s primary identifier straight away. If the data set has no mapping yet, or the column is not mapped, the button is Open identifiers instead. |
| A column has the same value in every record | Every profiled record has the same value in the column, so it tells records apart in no way. | Review mapping |
Setting the primary identifier from here changes the mapping only: records that were already processed keep their identifiers until you process the data set again. The other buttons only open a page; nothing changes until you make the change there.

Refresh the profile
The profile does not update itself as a data set’s records change - select Refresh profile, above the table, to recompute it from the data set’s current data.
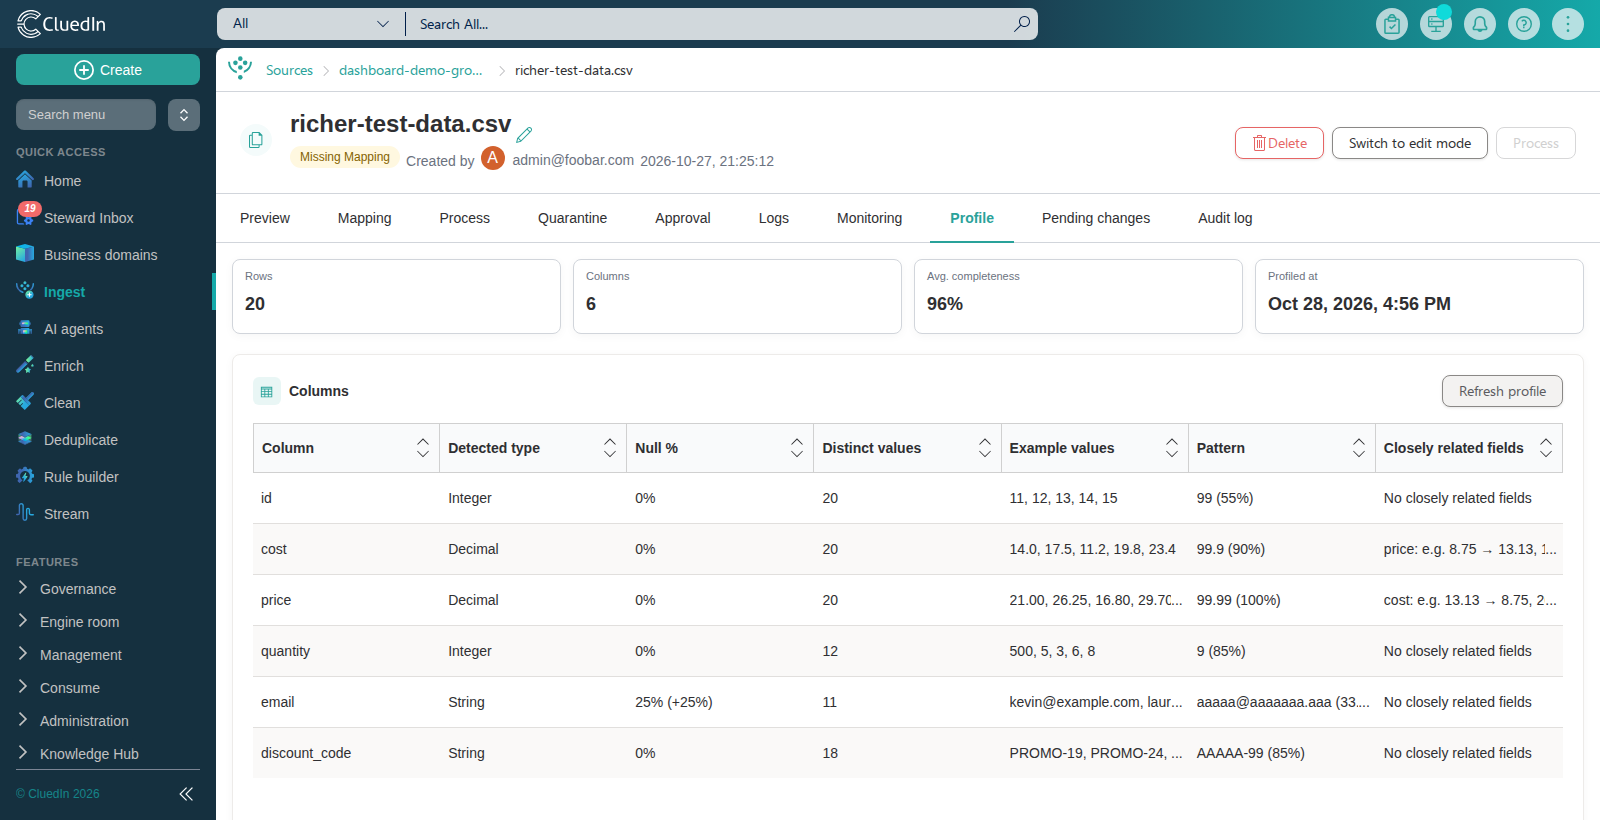
If a column’s null percentage changed since the last run, the Null % cell shows the new value together with the change, for example 25% (+25%). The change is only shown once you have refreshed a profile at least once; the first time a data set is profiled, there is nothing yet to compare it to.
Verify the result
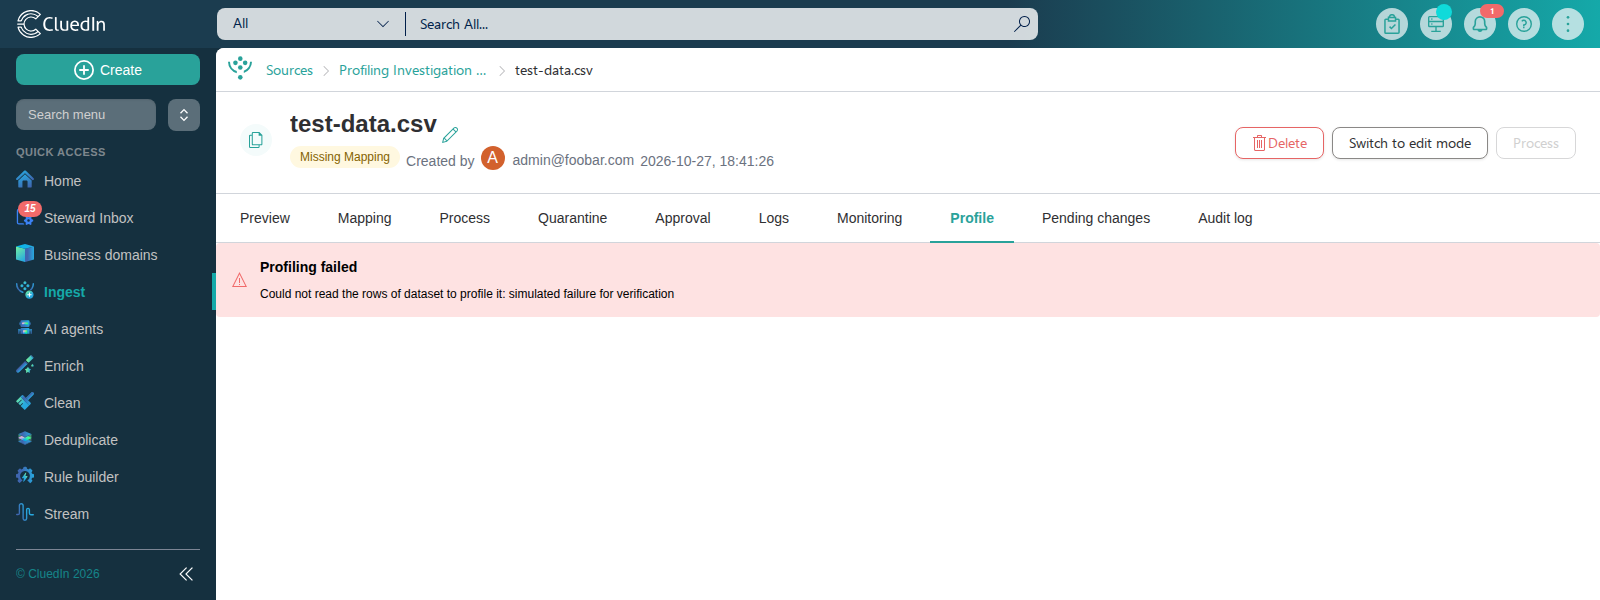
The Profile tab shows one of these states: not started (for a large data set awaiting a manual run), profiling in progress, the computed profile, or an error if profiling failed. Reloading the data set page after profiling finishes shows the generated results without the need to re-upload the data.
If something goes wrong
If profiling fails, the Profile tab shows a Profiling failed message with the error. Try reopening the tab to retry; if the problem continues, contact the person responsible for maintaining CluedIn for your organization.